🔄 Last updated: June 21, 2026
The reorder point formula for small retail is: (Average Daily Sales × Lead Time in Days) + Safety Stock. This guide shows how to calculate it for every product in your store using real numbers from gharstuff.com — and includes a free calculator you can use right now.
What is the reorder point formula for small retail?
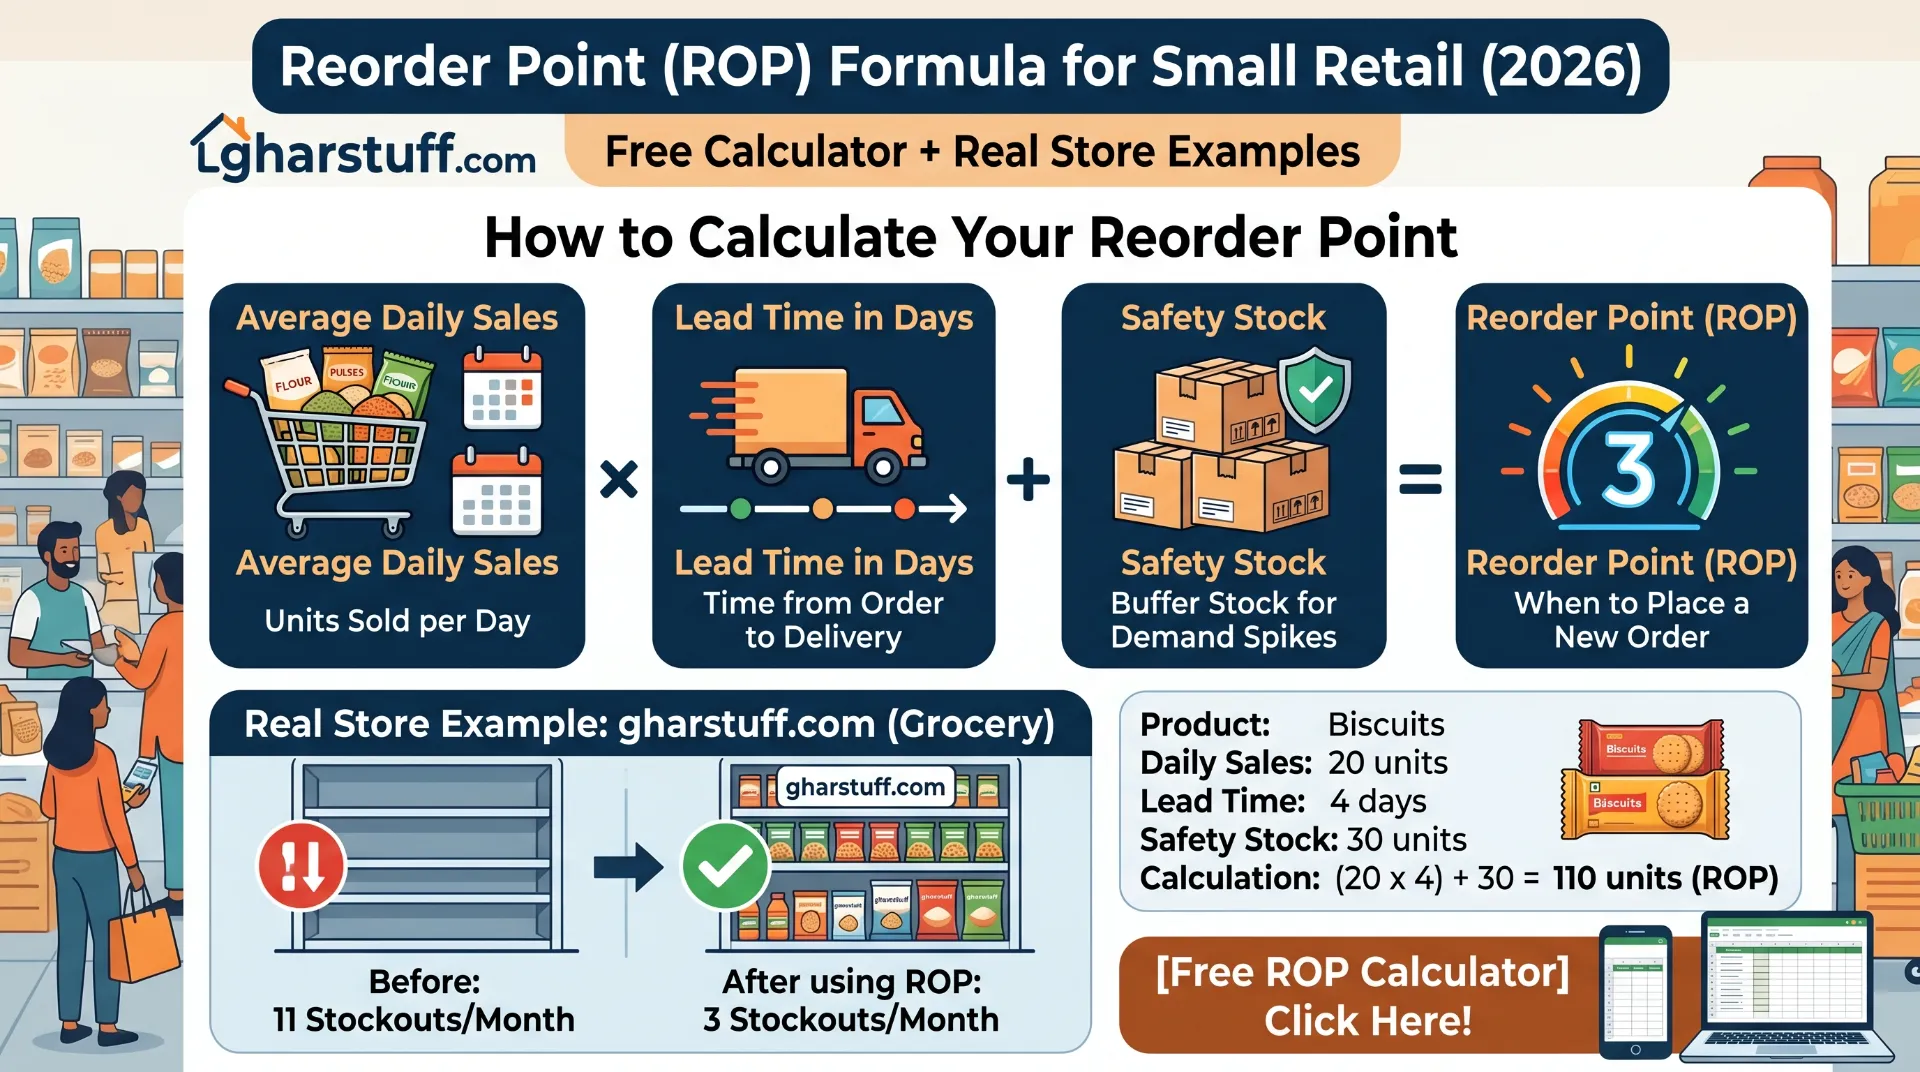
Reorder Point = (Average Daily Sales × Lead Time in Days) + Safety Stock. Example: you sell 20 units/day, supplier takes 2 days, safety stock is 20 units → Reorder Point = (20 × 2) + 20 = 60 units. When stock hits 60, place the order. The free calculator below does this for any product instantly at ₹0 cost.
Saturday morning, 10:30am. A customer asked for Tata Salt. Vishal checked the shelf. Empty. Checked the storage room. Empty. The supplier doesn’t deliver on Sundays. We lost 12 salt sales that weekend — not because we didn’t know salt sells, but because nobody knew when to reorder it.
That was the moment I stopped guessing and started using a reorder point formula for small retail. No software. No subscription. Just a simple calculation that tells you exactly when stock hits the number that means “order now.”
At gharstuff.com we track 800–1,200 SKUs in Hisar, Haryana. Before this formula, we averaged 11 stockouts a month. After? Three. The formula takes 5 minutes to learn and works on paper, in Google Sheets, or in any inventory software. Here’s exactly how it works — with an interactive calculator and real numbers from my store.
📚 What’s in this guide
The Reorder Point Formula for Small Retail — Explained Simply
The reorder point formula for small retail has three components. Each answers a different question about your stock:
Average Daily Sales
How many units do you sell per day on average? (Total sold ÷ number of days)
Lead Time (Days)
How many days from placing an order to receiving the delivery on your shelf?
Safety Stock
Extra buffer for late deliveries or demand spikes. Can be zero for predictable products.
The result tells you: when your stock level reaches this number, place your next order. Not before (you’ll overstock and tie up cash). Not after (you’ll run out before the delivery arrives).
💡 The insight most guides skip: The reorder point formula for small retail answers when to order, not how much to order. How much to order is a separate decision (Economic Order Quantity). For the full stockout prevention system, see the reduce stockouts guide.
Free Reorder Point Calculator — Use It Now
Enter your numbers below. Results update instantly. No account required.
🧮 Reorder Point Calculator
Total units sold ÷ number of days
Days from ordering to receiving
Leave 0 if unsure — section below explains
Not sure what safety stock to use? Start with 1–2 days’ worth of sales as a buffer. The section below explains how to calculate it precisely.
How to Calculate Safety Stock for Small Retail
Safety stock is the buffer that protects you when your supplier is late or demand spikes unexpectedly. For a small grocery store, two things cause stockouts even when you’ve ordered on time: a delivery that arrives one day late, and a weekend that sells twice your average daily volume.
The precise safety stock formula is:
Example — Amul Butter 100g:
- Average daily sales: 6 packets | Maximum daily sales: 12 packets
- Average lead time: 2 days | Maximum lead time: 4 days
Safety Stock = (12 × 4) − (6 × 2) = 48 − 12 = 36 packets. The textbook answer. In practice for a grocery store, 36 packets of butter expiring in 15 days is overkill. As noted in NetSuite’s safety stock guide, the formula needs adjustment for perishables — which is where the simpler category approach below helps.
For most small store owners, a category-based approach works just as well:
Very predictable products
(atta, cooking oil, staples) → 1 day of average sales
Perishables with variable demand
(milk, curd, paneer) → 1.5–2 days of average sales
Seasonal or unpredictable items
(festival items, fresh produce) → 3–5 days of average sales
Unreliable supplier
(add delay days) → average days late × daily sales
⚠️ Always use maximum lead time for safety stock, not average. The one time your supplier takes 5 days instead of 2 is the time you’ll stock out if you planned for the average. Track actual deliveries for 30 days before setting lead time numbers.
3 Real Reorder Point Examples From gharstuff.com
Real numbers from my store. I’m using them because every worked example I found online uses fictional “Widget A” — which gives you no feel for whether the numbers make sense in actual retail.
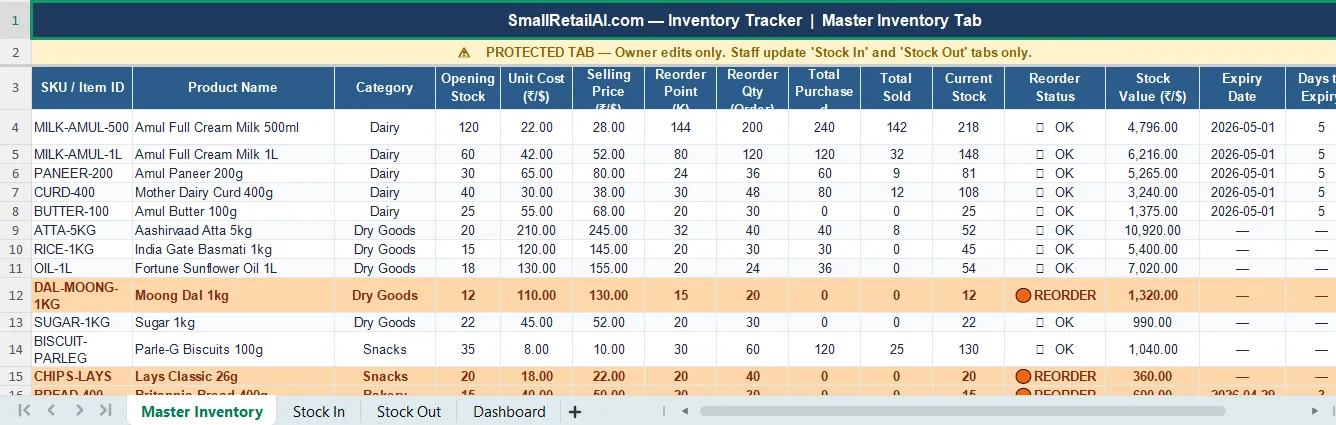
The Reorder Point Formula for Small Retail in Google Sheets
If you’re using the Google Sheets inventory template, your Reorder Point column (wherever you’ve placed it in your sheet) can be auto-calculated with this formula:
Where Q2 = Average Daily Sales, R2 = Lead Time Days, S2 = Safety Stock. ROUNDUP ensures you always round up to a whole unit — you can’t reorder half a packet of atta.
The status formula in column J flags automatically when stock crosses the reorder point:
As explained in inFlow Inventory’s reorder point guide, combining a calculated reorder point with automated status flagging removes the daily mental burden of checking every product manually — which is what breaks down when you’re managing 300+ SKUs.
3 Mistakes I Made Before Getting the Reorder Point Formula Right
Real mistakes — not theoretical ones — and I see every new store owner make at least one of them.
Automating Reorder Point Alerts With Zoho Inventory
The Google Sheets formula works. But it requires someone to open the sheet and check the status column. Zoho Inventory’s free plan does this automatically — when any product’s stock drops to or below the reorder point you’ve set, it flags it in the dashboard without anyone needing to check.
In Zoho Inventory, reorder points are set per item: Inventory → Items → select any product → set the Reorder Point field. Zoho then tracks every stock movement and shows a “Low Stock” alert the moment any product crosses the threshold. The Zoho Inventory setup guide covers the reorder point configuration in detail, including how the free Python expiry alert script adds automated daily email notifications on top of Zoho’s built-in alerts.
💰 New user bonus — Zoho Inventory free plan
Set automated reorder point alerts for up to 1,000 SKUs at ₹0/month on Zoho’s free plan. New users get $100 in Zoho Wallet credits when signing up through this link.
Try Zoho Inventory Free → Get $100 CreditsWhat Happened After I Set Reorder Points at gharstuff.com
Stockouts per month (73% reduction)
Cost to implement
Vishal’s daily stock check time
One-time setup for top 50 SKUs
| Metric | Before reorder points | After 3 months |
|---|---|---|
| Stockouts per month | 11 | 3 — 73% reduction |
| Emergency orders to supplier | 6–8/month | 1–2/month |
| Customers asking for unavailable item | ~15/week | ~4/week |
| Time Vishal spent deciding what to order | 25–30 min/day | 90 seconds (scan status column) |
FAQs — Reorder Point Formula for Small Retail
Q1: What is the reorder point formula for small retail?
Q2: How do I calculate average daily sales for the reorder point formula?
Q3: Can I use the reorder point formula for small retail without safety stock?
Q4: How often should I recalculate reorder points for my store?
Q5: Can I use the reorder point formula with a paper notebook?
Q6: How do I set reorder points in Google Sheets automatically?
Q7: Can Zoho Inventory automate reorder point alerts for small retail?
Q8: Is the reorder point formula for small retail the same for US and India stores?
📥 Free Download — Reorder Point Calculator + Inventory Toolkit
📥 Free Toolkit — Reorder Point Calculator + Google Sheets Template + Full Inventory Kit
The AI Inventory Toolkit includes the reorder point calculator worksheet (pre-built with the formula for 30 products), the Google Sheets inventory template with column K already configured, plus the ChatGPT Prompt Library, Zoho Expiry Alert Python script, AI Waste Tracker, and WhatsApp Broadcast Templates.
Free. No spam. Unsubscribe anytime.
Calculate Your Top 10 Reorder Points Today
You don’t need to set reorder points for every product at once. Pick your top 10 — the products that cause the most stockouts. Run each through the calculator above. Enter the results in column K of your Google Sheets template or Zoho Inventory. That’s 20 minutes of work. The stockout reduction starts the same week.
- Reorder Point = (Daily Sales × Lead Time) + Safety Stock. Use the calculator. It costs nothing.
- Use actual lead times, not supplier promises. Track deliveries for 30 days and use the maximum observed.
- Start with your top 10 products this weekend. 20 minutes prevents most stockouts.
Pick one product right now — your most frequently stocked-out item.
Run it through the calculator above. Enter that number somewhere Vishal can see it. That’s the whole experiment. Do it for one product before you close this tab.
The next step after reorder points is expiry date tracking — the other half of the inventory problem for any store with perishables. The food waste reduction guide covers expiry management with the same practical approach, including the Python alert system that replaced our manual morning check entirely.

About the Author
Rahul Saini
Grocery store owner in Hisar, India, running gharstuff.com since 2019 with 800–1,200 SKUs daily. I test AI tools in my real store — with real staff, real customers, and real consequences when something doesn't work. Every number on this site is from my actual store.
Read My Full Story →Related Articles
Last updated: April 2026. Formula verified against QuickBooks, Unleashed Software, inFlow Inventory, and NetSuite references. Author: Rahul Saini, SmallRetailAI.com.
What product causes the most stockouts in your store? Tell me in the comments — I’ll show you the exact reorder point calculation for it.